Energy Dashboard
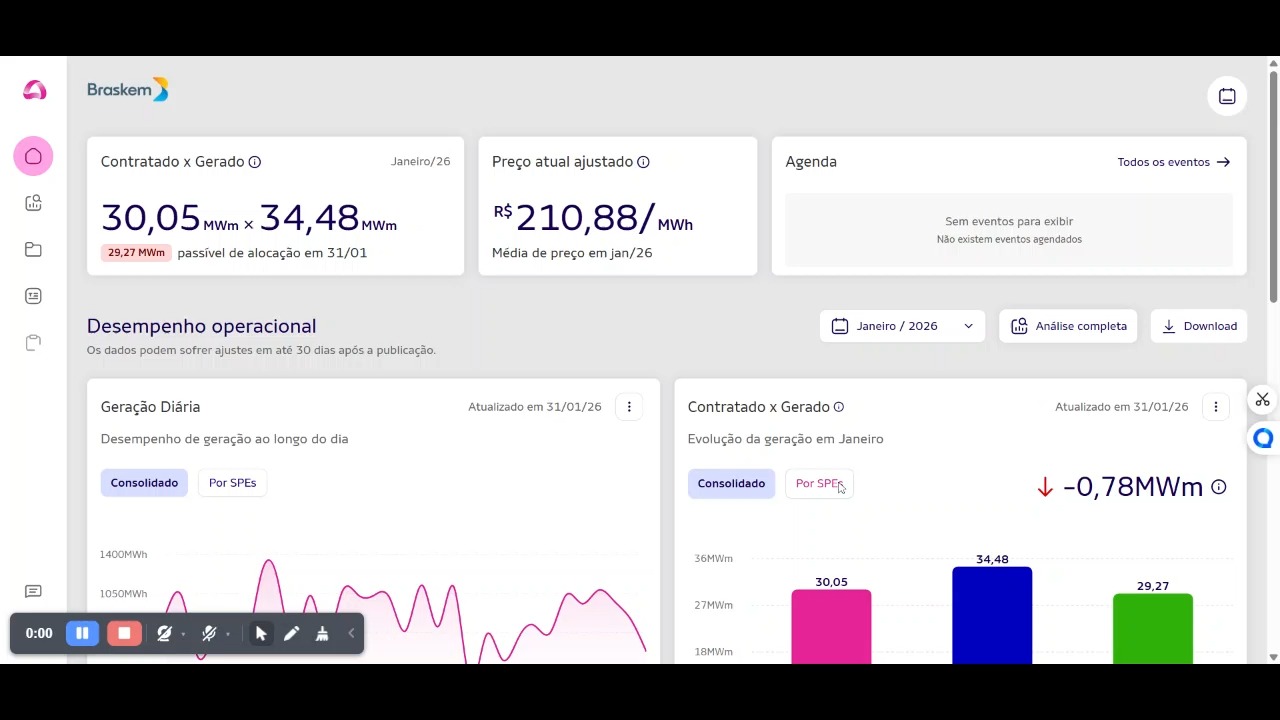
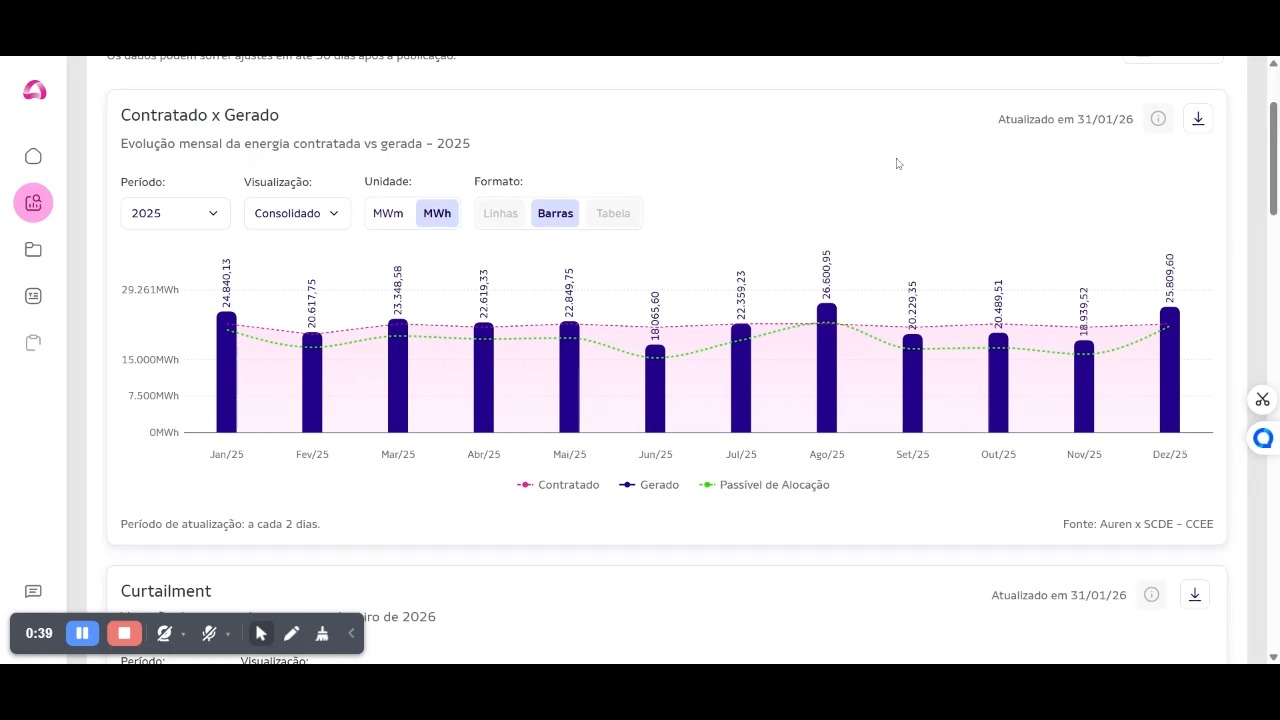
Enterprise real-time energy data analytics platform designed for self-generation energy clients. The system consolidated operational data from power plant data lakes — such as curtailment, availability, and generation metrics — into interactive dashboards with high-performance visualizations and integration with multiple energy market data sources and APIs.
Challenges
The main challenge of the project was to create an interface capable of presenting a large volume of complex data in a clear and intuitive way, ensuring that users could easily access and interpret the relevant information for managing their energy assets and maintaining a high level of user experience performance.
Solutions
In the frontend, we adopted a stack composed of React + Vite, Tailwind CSS, Recharts and shadcn/ui, and implemented react-query for cache management of requests, in addition to performance optimizations such as code-splitting, lazy loading and controls to avoid unnecessary re-renders because it would be an extremely costly process due to the large volume of data. We followed the MVVM (Model-View-ViewModel) architecture to ensure a clear separation between business logic and user interface, facilitating maintenance and scalability of the code.
Role
Senior Frontend Engineer
Impact
The AMP resulted in a powerful and efficient tool for energy producers, enabling them to monitor and manage their assets effectively. The intuitive interface and advanced features provided an exceptional user experience, contributing to customer satisfaction and product success in the energy market. The technical decisions adopted allowed for an extremely fast delivery with high performance, even including features that were initially planned for the second phase of development.